

You're running a business on one number
Most clinic owners can tell you what came in last month. After that it gets fuzzy: which provider keeps clients coming back, which payer drags its feet, where new clients actually come from. So you guess, and you make real decisions on those guesses.
Type a question. That's the whole workflow.
Type the report you want
Type it like you'd say it, “bar chart of revenue by provider, month over month,” and Clerie hands back the chart, not a data dump.
Follow up like a conversation
Every answer reads your live clinic data, so you drill the way you'd ask a person: “Now break that down by location.”
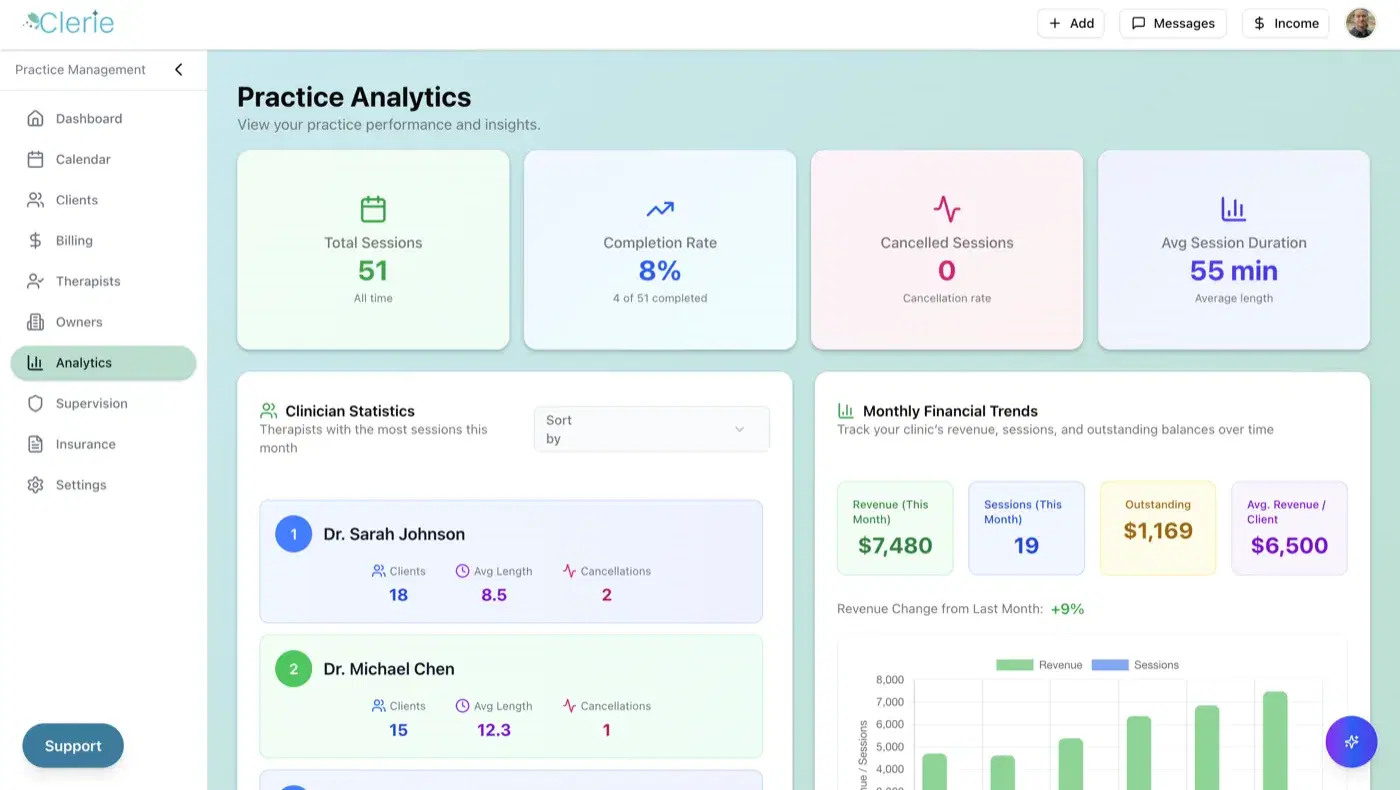
Pin it to your dashboard
Pinned reports refresh on their own, so next month's numbers show up without you asking twice.
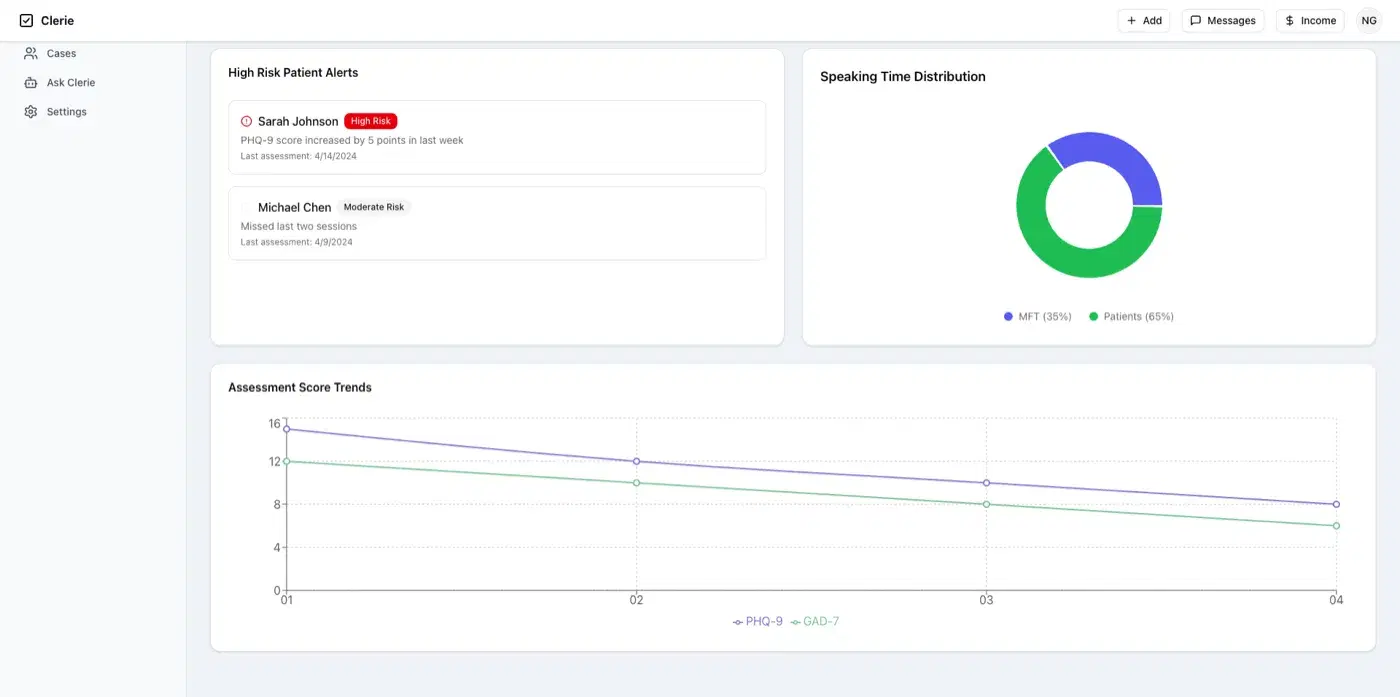
Find out who to market to
Pull income by demographic, spot that most of your revenue is college students coming in for anxiety, and aim your next ad at UVU instead of the whole county.
Who your revenue actually comes from
What you can actually pull
- Provider performance: who's booked solid, who has open slots, whose clients come back
- Payer behavior: which payers pay you the most, which are slowest to pay
- Utilization, cancellations, and where your new clients actually come from
- Income by demographic, so you know exactly who to market to
- Preloaded reports: monthly financials, payroll data, primary-diagnosis distribution
Covers the revenue side of the business: income and accounts receivable. Not expenses, not a P&L.
Replacesmonth-end Excel exports, Google Sheets, your EHR's canned reports, the report builder nobody ever learned.
Ask for any report, not just the preset ones.
Other EHRs hand you a fixed report list. Clerie builds the report from your question.
One sentenceis the whole skill. No SQL, no report builder, no training video.
“Look and functionality are clean and simple, easy to use, saves me time.”
The questions people actually ask on demos.
Bring a question we can't answer
Bring the thing you've been guessing at, and we'll type it into Clerie and show you the chart, live.